Data Refresh View
The Data Refresh view allows you to investigate in detail how your data is being refreshed on the server. A new active refresh will appear when a new refresh is triggered through the TOM Explorer.
A new refresh will run in the background so that you can continue to build your dataset, and Tabular Editor will let you know if the refresh fails with a pop up.
Data Refresh view columns
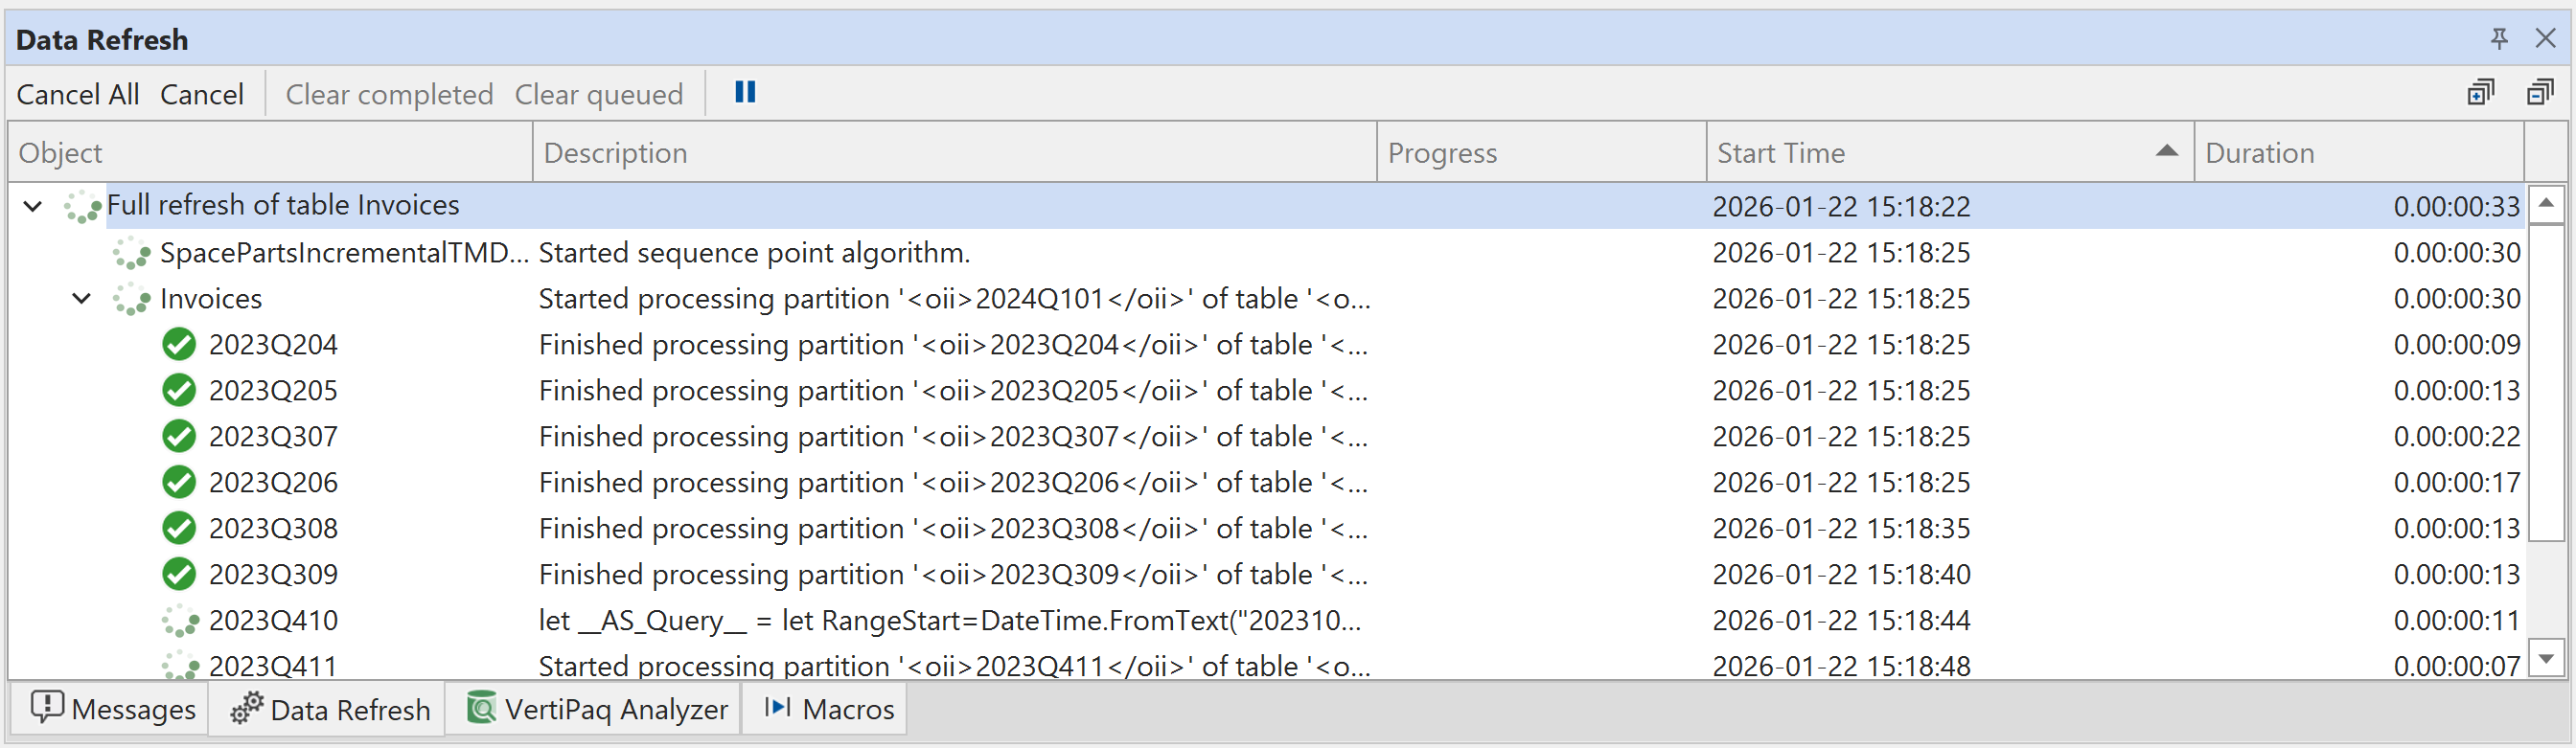
The Data Refresh view displays the following information for each refresh operation:
- Object: The name of the model object being refreshed (table, partition, or model)
- Description: Additional details about the refresh operation and its current state
- Progress: Shows the number of rows that have been imported so far.
- Start Time: The date and time when the refresh operation began. This is useful for tracking when operations were initiated, especially when multiple refreshes are queued
- Duration: The elapsed time since the refresh operation started, updated in real-time for active operations
Sorting refresh operations
You can sort the refresh operations by clicking on any column header. This is particularly useful for:
- Clicking the Start Time column to sort refresh operations chronologically, with the most recent operations appearing first (descending sort) or last (ascending sort)
- Sorting by Duration to identify long-running operations
- Sorting by Object to group refreshes by table or partition name
Click a column header once to sort ascending, and click again to sort descending. This makes it easy to identify the latest refresh operations when working with multiple refresh queues.
Note
All the messages and durations shown in the Data Refresh window are estimates only. Tabular Editor listens to trace events from SSAS during processing. SSAS is not guaranteed to send all trace messages to the client (for example it may throttle the trace event notifications during times of peak CPU/memory consumption).
Tip
If you need accurate and reliable information about refresh progress and durations, you should connect SQL Server Profiler to your SSAS instance, and collect the information manually during processing.